Even Early Results as of (June, 2011) Demonstrated the Power of DNA to Confirm (or Challenge) Documentary Research
Already in June, 2011 the Pemberton DNA Project hosted at FamilyTree DNA had 6 full results for their Y-37 (37 markers) tests. Three of these six are well documented back to Cheshire, England, in the 1600’s and a fourth one, whose DNA shows he is a not too distant cousin of the first three, is from a man presently living in Cheshire. These are valuable additions to the project as they will prove a means of helping other American lines get “over the pond” when their samples prove to be similar enough. The other two samples show very distant relationship to the first four. It is no surprise that two Pemberton’s appear to have their most recent common ancestor (MRCA) a thousand years ago or more. It is probably that several unrelated families, who lived in Pemberton, Lancashire, for example, would adopt the surname during those years when surnames were first coming into common usage.
The Exact DNA Profile of George Pemberton, b. about 1660 Is Positively Identified
The group of four tests now has enough data in it to infer the exact DNA of their earliest known Pemberton ancestor, born about 1660 in Cheshire, England. The process used to make the inference is called “triangulation”. The report of these tests can be seen·here within the Pemberton DNA Project pages on Family Tree DNA. The ancestor’s profile is on the line (or row) labelled “Mode” and was inferred directly from the test results of his documented progeny. Notice that the four tests in in the group “George Pemberton, ca 1685, Cheshire, England” each have one marker in mutation from the Mode. By identifying these mutations, the ancestor’s DNA markers are deduced. This ancient pattern can now be used to test any new DNA results to see if that person belongs to this tree. As the number of tests grows, more trees will be identified and documented.
The DNA of the Hugueot Branch of the Pemberton Family is Identified and it is not French
When the second DNA sample from a male Pemberton (who traced his line back into Manakintown, VIrginia Colony) formed a 100% match [Ed. Note – March 20, 2016, these tests have been expanded to 67 markers and remain 100% identical.] to an existing sample with the same geographical background, we knew we had identified this branch. It is, however, important to be careful with this kind of information and state the facts without inferring things that may or may not be true.
What we didn’t know until 2016, is whether this line was truly French Huguenot in its earliest history, but in March, 2016 one of these tests had been analyzed by the Ancestry ethnicity test and found to be 39% British, 32% Irish but only 4% Western Europe (France and Germany). So this branch of the Pemberton family which has been called Huguenot because it came through the Huguenot village of Manakintown, Virginia is not French.
The DNA of the ffrench-Pemberton or New Zealand Branch is Identified
John Pemberton, a New Zealander of the famous old ffrench-Pemberton line, joined the Pemberton DNA Project and proved that this famous old branch has a completely different biological origin than the other lines found in the Project so far. The fact that only 19%of his markers match the other branches means that biologically, this line has a common ancestor with the other Pemberton lines thousands of years ago.
John has shared details about the first father in this line: Robert Pemberton. Record of him was found in the Foundling Hospital, Coram’s Fields, London, UK. Family history suggests he was given the name of one of the Foundling Home’s Directors. More information about this branch can be found in the famous book, Pemberton Pedigrees by Robert Charles Boileau Pemberton, in the notes to Chart 40 entitled “The ffrench-Pembertons, of New Zealand”.
How DNA is Assisting Research on this Pemberton Branch
This group of four tests is particularly interesting because it demonstrates several things about the vaue of DNA as a research adjunct. Three of the tests come from contemporary Pemberton males whose documentary lineage is confirmed by the DNA results. That lineage goes back into Cheshire, England. The fourth DNA sample comes from a resident of Cheshire whose documentary line goes back to about 1770, which is 60 years short of the time the ancestor of the first three emigrated to the Virginia Colony. So it was with surprise and delight that they discovered that all four are relatively close cousins.
The so-called “triangulation method” is used to infer or deduce the DNA of an ancestor whose DNA is no longer available (without a lot of fuss anyway). The method uses the DNA of contemporary donors who are known through ordinary documentary research to be cousins, or, in other words, to have a common ancestor. Using Y-DNA, this ancestor will be male.
The following chart of test results for 4 contemporary donors will help you understand the triangle diagram below it. The titles over each column are 6 of the 37 markers that are evaluated in the Y-DNA-37 test. The row called “Mode” shows the dominate value for the marker among the 4 kits tests. And the first two marker columns (DYS393 and DYS390) are examples of how all the other columns look, that is, all four tests had the same value for that marker. So this chart shows 6 markers, the other 31 markers that are not shown are like these first two columns – each kit showed the same value. The 4 other columns where you see colored values, are the four markers that show a mutation of that marker’s value among the four people tested. Notice that the “Mode” value for those columns is the value that dominates that marker in the four samples tested (3 out of 4 are the same).
| Kit | DYS393 | DYS390 | DYS439 | DYS447 | DYS464b | CDYb | |||
| Mode | 13 | 23 | 12 | 24 | 16 | 40 | |||
| Gordon | 13 | 23 | 12 | 24 | 16 | 38 | |||
| Jackson | 13 | 23 | 12 | 24 | 17 | 40 | |||
| Ernest | 13 | 23 | 12 | 25 | 16 | 40 | |||
| George | 13 | 23 | 13 | 24 | 16 | 40 |
The Triangulation Method
The triangulation method simply means that looking at all this data, we can see first that they must be cousins and come from a single common ancestor because 36 out of 37 markers are the same. And second we see that the only way these four people could come from a single male ancestor is if that ancestor had these dominate values in his DNA.
The triangular diagram below illustrates the descendency and shows where the mutations occured for these 4 tests. The lines in black indicate documented relationships while the purple lines show several possible relationships between the fourth sample and the first three. Since mutations occur at random and generally not at all for several generations, it is impossible to know exactly which purple line will prove to be the correct one. The value of the DNA is that there is no question but that there is a close relationship and this guides and energizes the documentary research. The pedigree of the fourth test will definitely intersect the pedigree of the first three within a few generations.
Given these results and the documentary pedigrees involved, we can diagram the transmission of DNA from the most recent common ancestor (MRCA) down. The notations show the relevant markers and their values. When a mutation is detected along a descendency line, it looks like this CDYb –> 38 meaning, in this example, that somehwere along this line CDYb mutated to the 38 value.
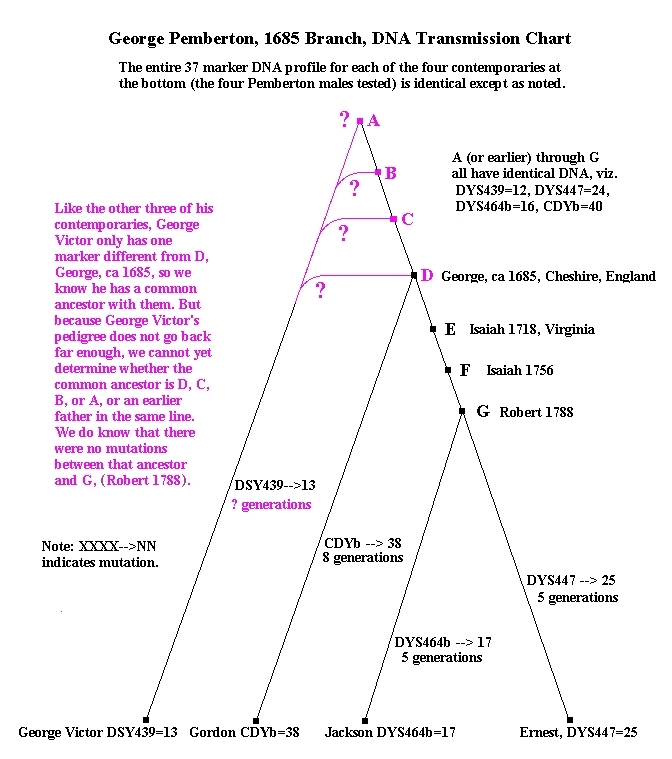
This diagram is interesting because it demonstrates the value of DNA in confirming documentary research as shown in the case of (across the bottom) Gordon, Jackson, and Ernest. It also shows that George Victor is a cousin with these other three even though there is no documentary evidence of that. That has resulted in the creation of a research group where the four can collaborate on the exciting task of finding the documents that will merge these pedigrees into one larger and longer.
Notice: One difficulty with the diagram is that it seems to infer that Robert’s sons had different DNA, and that, in fact, is a possibility. However, it is more probable that his sons’ DNA were identical. What we do know for certain is that somewhere in the 5 generations between Robert and Jackson there was a mutation of DYS-464b from a 16 value to 17, and somewhere between Robert and Ernest there was a mutation of DYS-447 from 24 to 25.
DNA Trees Will Identify Which Tree Today’s Men Belong To and Allow Researchers to Leap Over Brick Walls
This is the exciting result of the Pemberton DNA Project as it grows. New trees will be identified and new tests will fit in those trees and people will know almost before they start research, which tree they belong to.
Another Benefit of DNA Shows Up Early
The first three tests in the project (not to be confused with the three tests at the bottom of the chart above) proved the value of this wonderful assistance to the traditional documentary approach to research. All three samples are from Pemberton lines known to go through the Virginia Colony in the 1700’s. The surprising results of these tests is that they do not show a close relationship. That means their most recent common ancestor (MRCA) is at least several generations earlier. These have completely changed the way researchers read the documents available and is an invaluable assistance in that work.
As the DNA data in the project grows, there will be more and more opportunity for researchers to break down their “brick walls”, sometimes from the back side.
If you are new to DNA and want to read up on it a bit, we suggest you look at the articles listed on this website (the PFWW) and on the Pemberton One-Name Study page which you can find here:·http://www.one-name.org/profiles/pemberton.html. Just take the link to “DNA Project” and look for the last two lines there.